Consolidated Financial Highlights
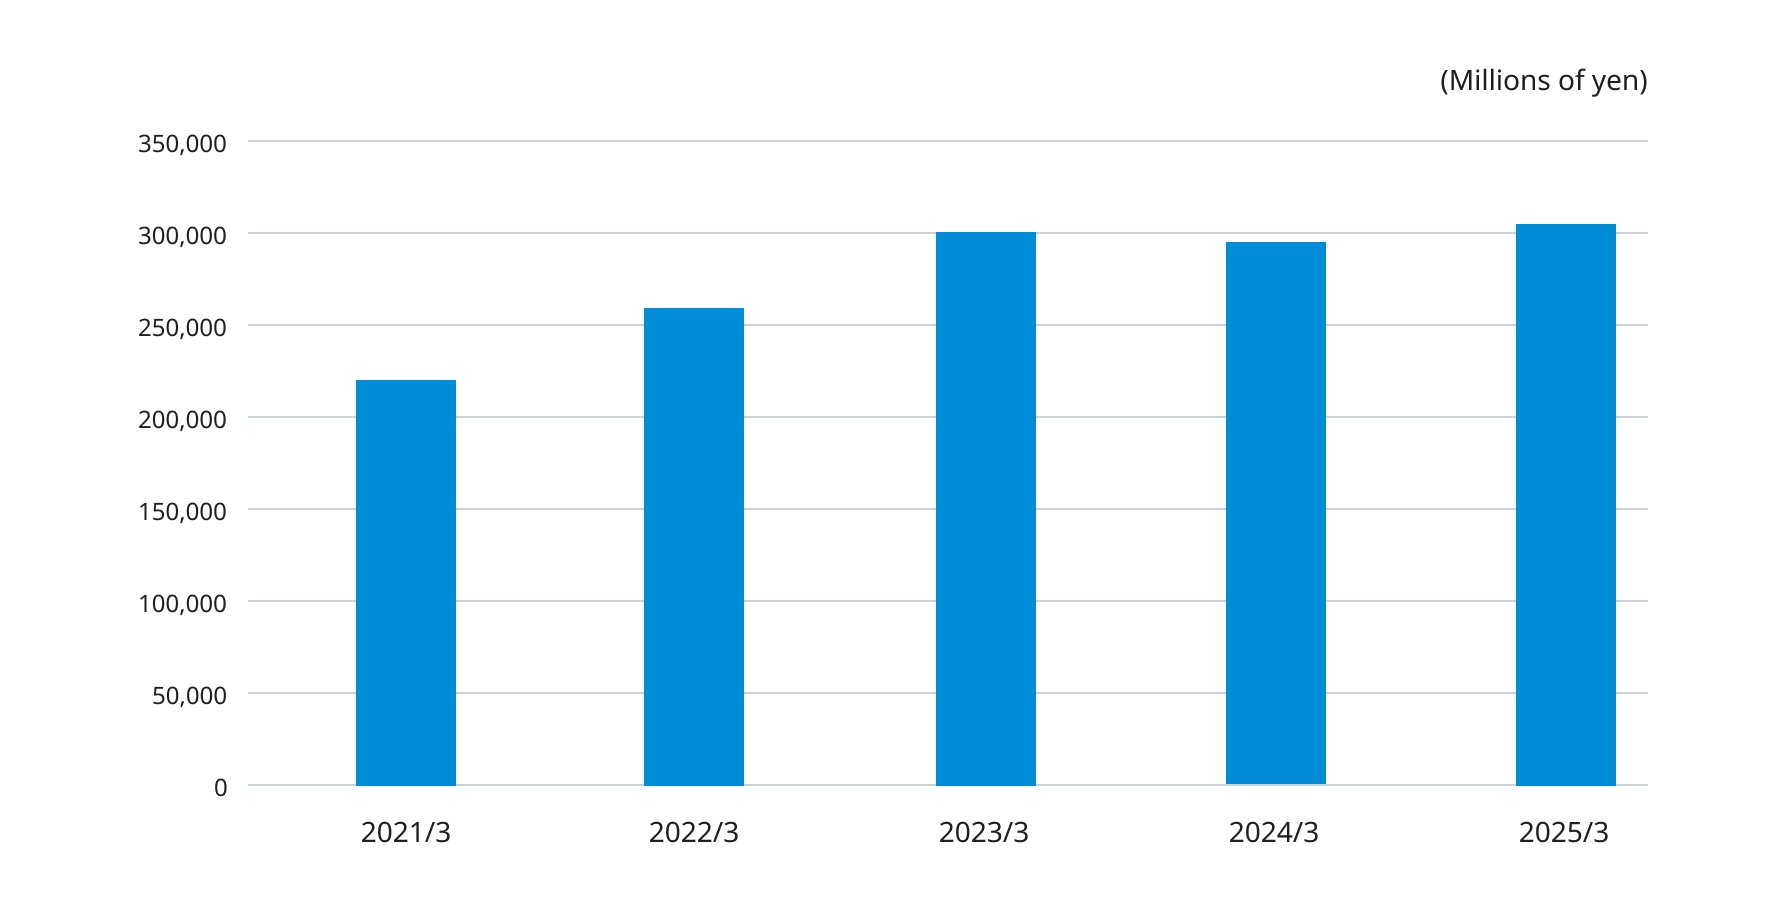
Net sales
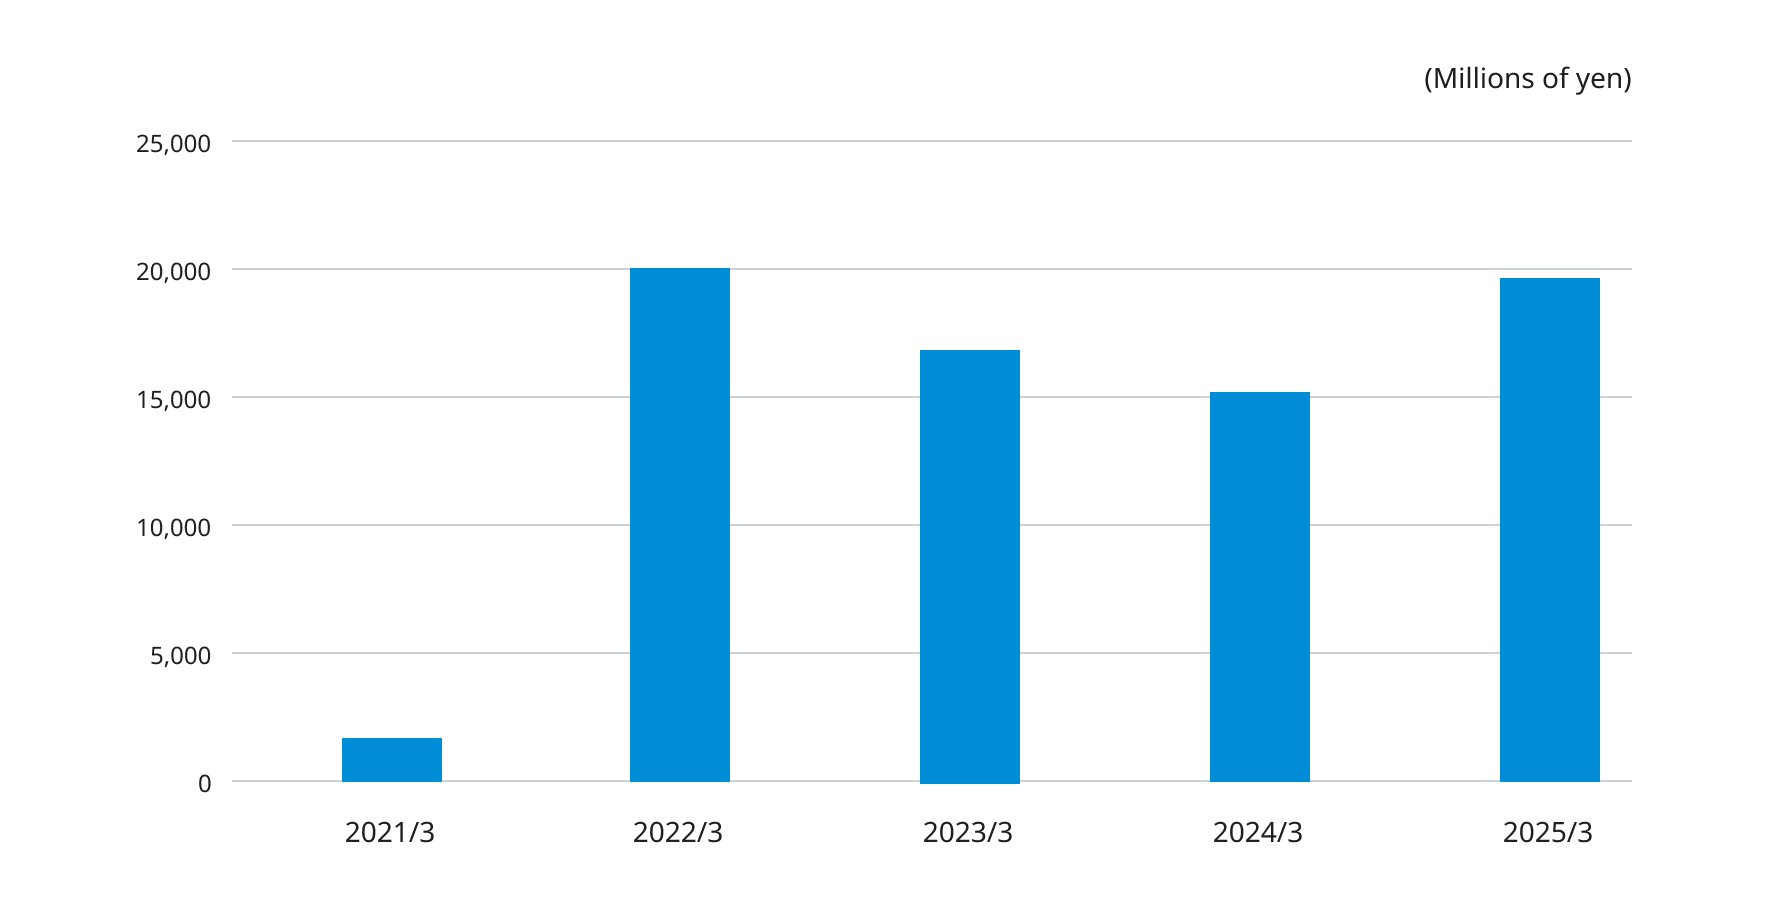
Operating income
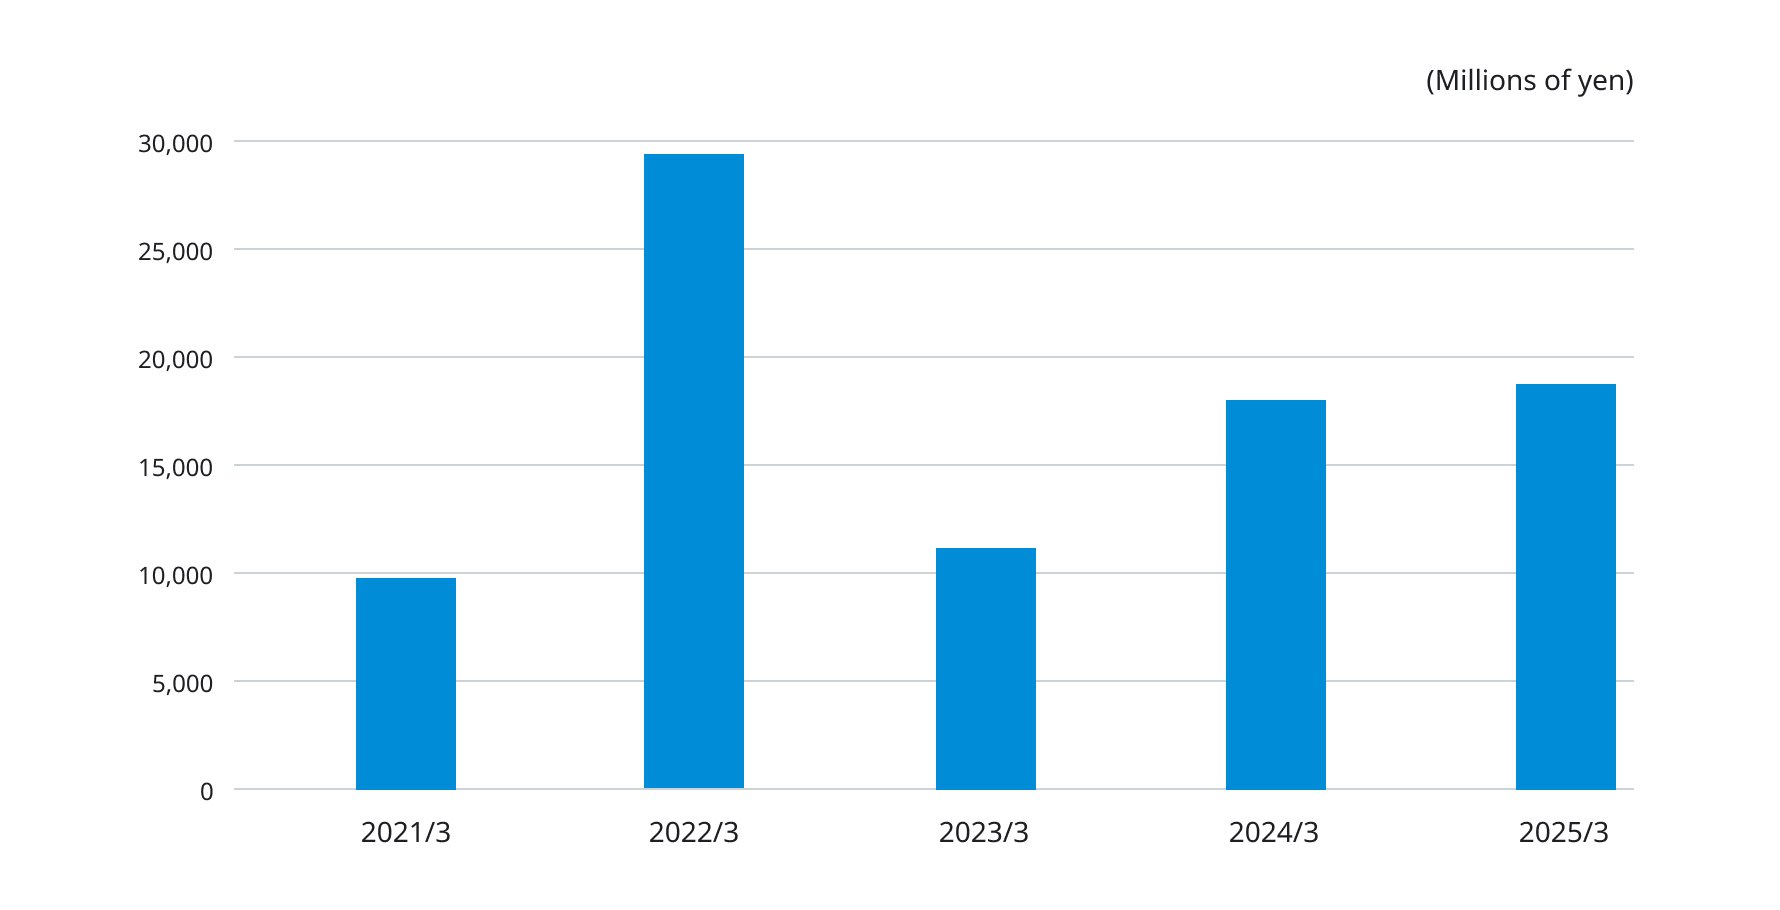
Ordinary income
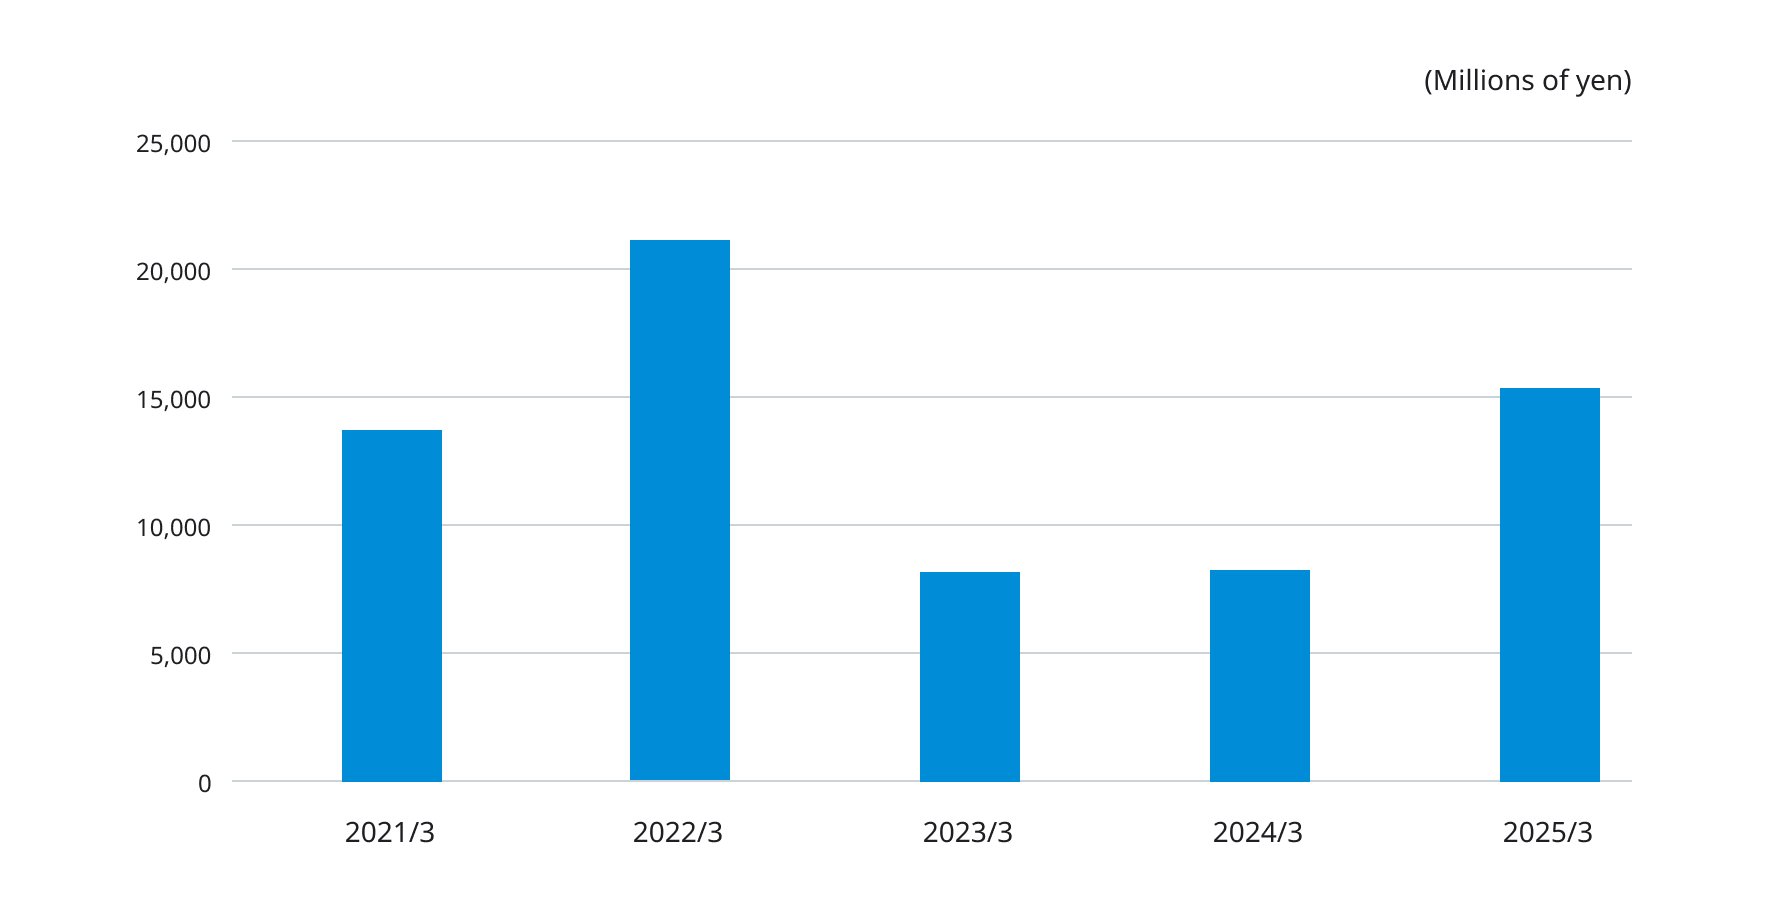
Net income attributable to owners of parent company
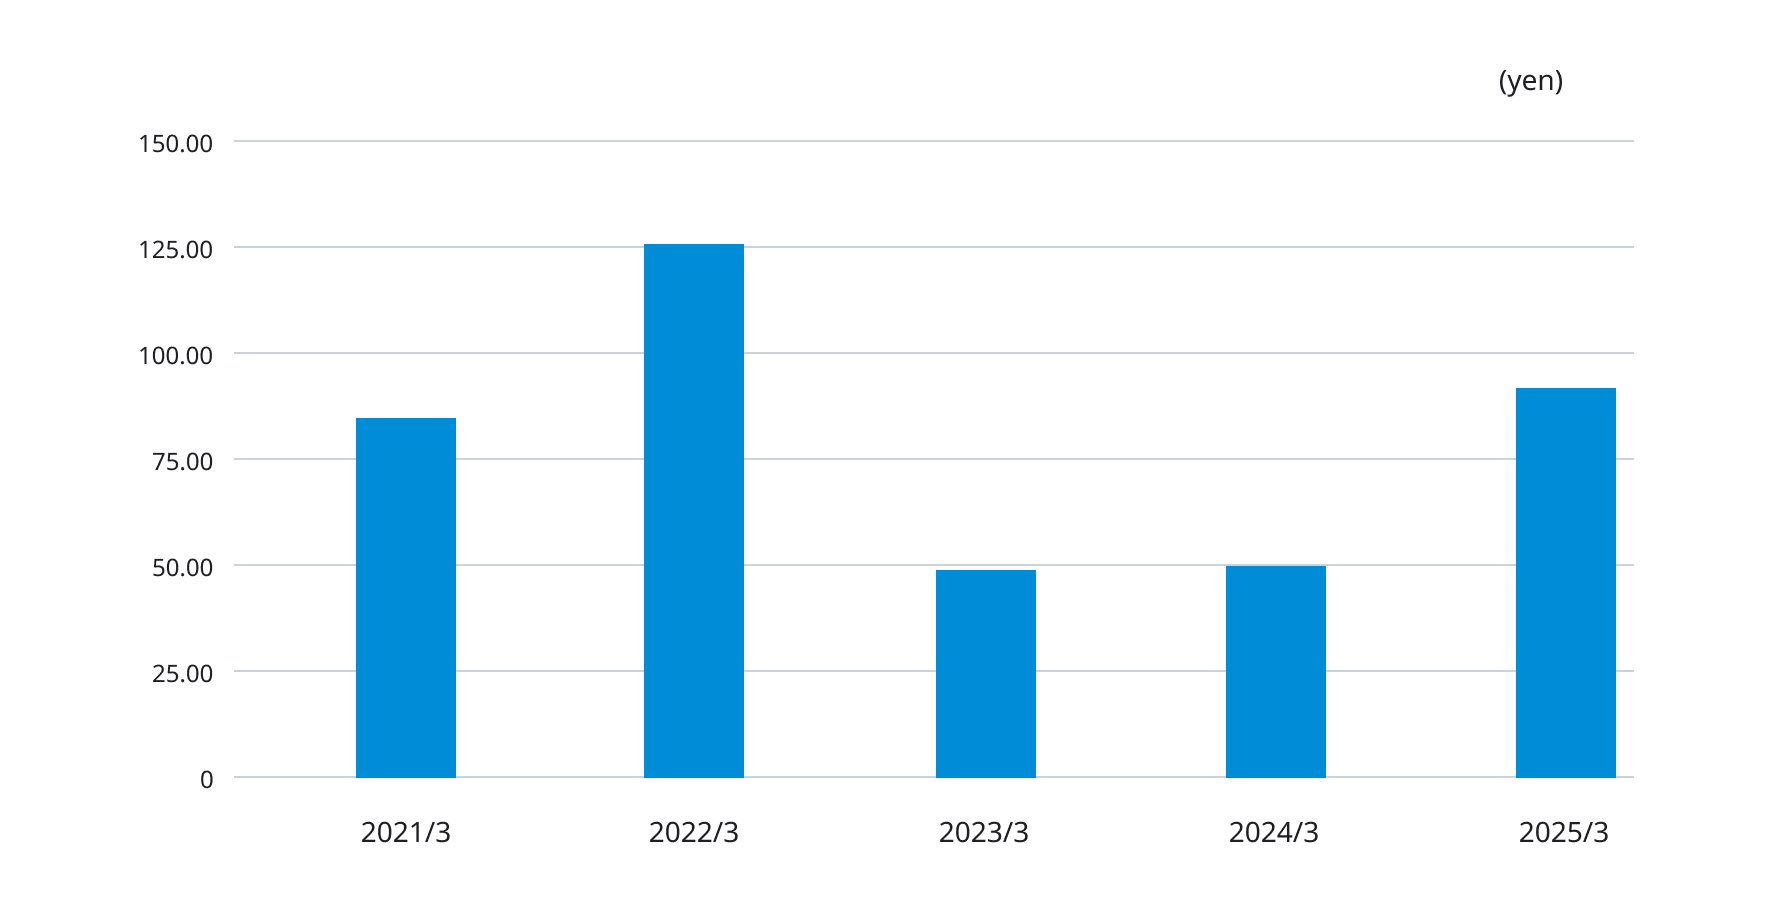
Earnings per Share
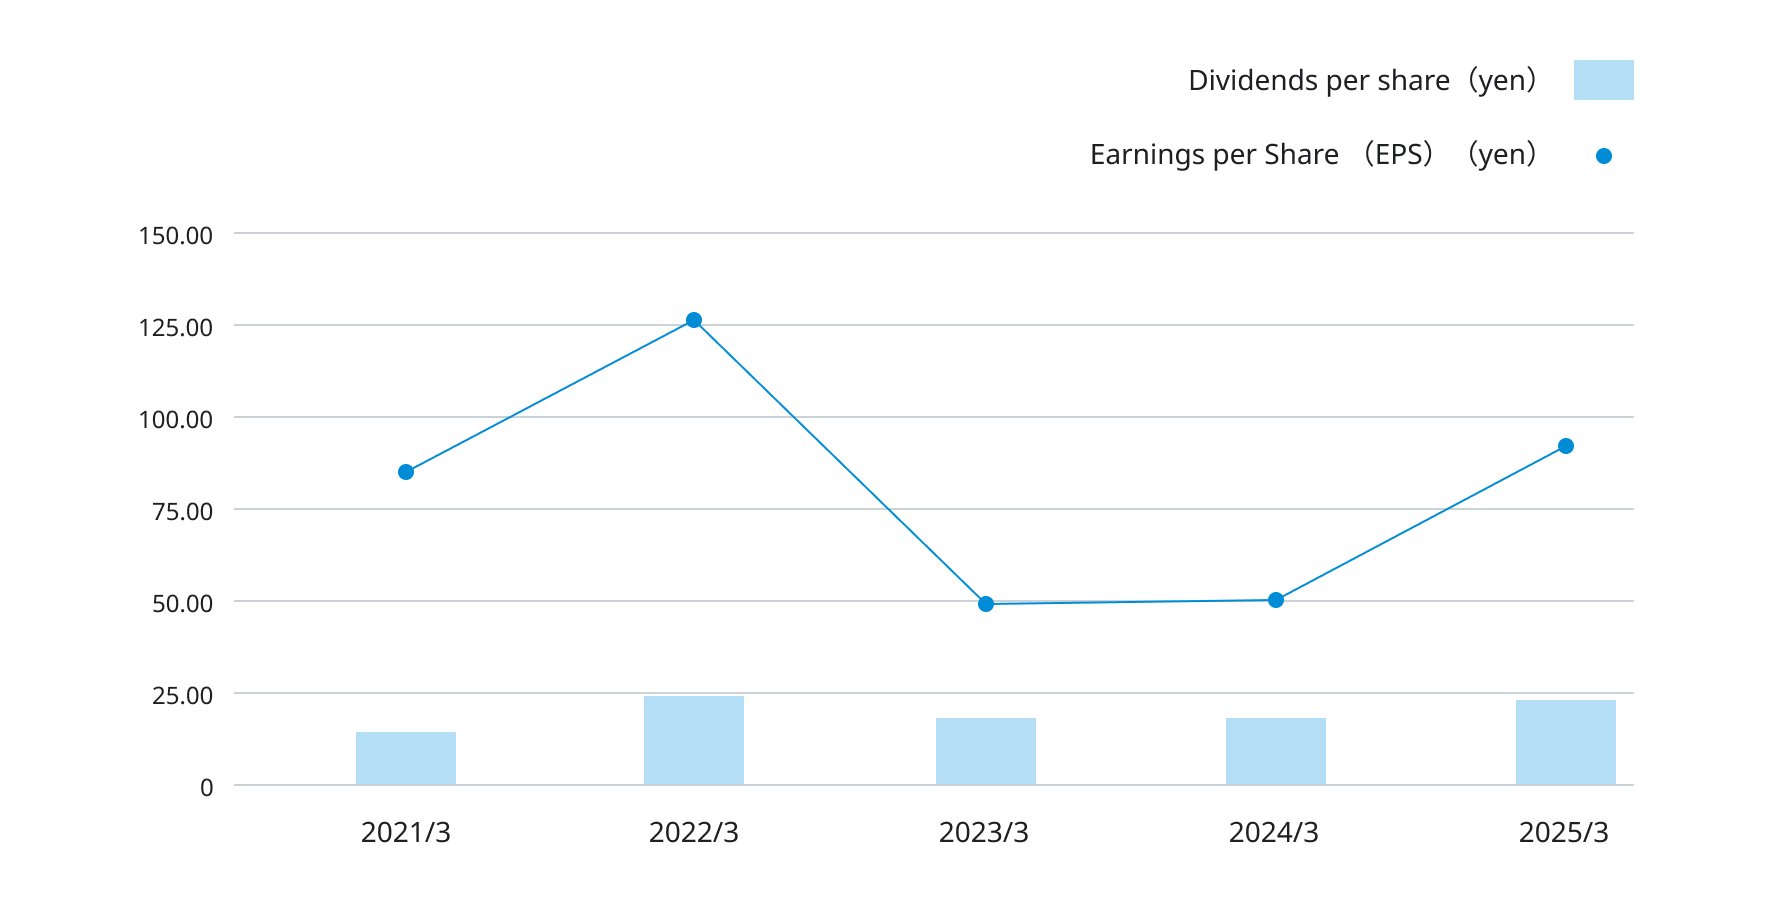
Dividends per share / Earnings per Share (EPS)
Financial data (Millions of yen)
|
item |
2021/3 |
2022/3 |
2023/3 |
2024/3 |
2025/3 |
|---|---|---|---|---|---|
| Net sales |
222,454 |
261,617 |
301,205 |
297,057 |
305,718 |
| Operating income |
1,702 |
20,456 |
17,288 |
15,268 |
19,728 |
| Ordinary income |
9,757 |
29,515 |
11,472 |
17,757 |
18,759 |
|
Net income attributable to owners of parent company |
14,173 |
21,207 |
8,326 |
8,388 |
15,529 |
|
EBITDA (Note 1) |
24,802 |
43,255 |
24,263 |
31,618 |
32,836 |
|
Capital expenditures |
14,136 |
13,462 |
12,532 |
15,314 |
19,356 |
|
Total assets |
363,075 |
376,956 |
388,445 |
415,693 |
418,883 |
|
Net assets |
195,419 |
216,974 |
225,950 |
252,465 |
265,870 |
|
Interest-bearing debt |
113,991 |
99,088 |
103,726 |
104,362 |
88,973 |
Cash flows (Millions of yen)
|
item |
2021/3 |
2022/3 |
2023/3 |
2024/3 |
2025/3 |
|---|---|---|---|---|---|
|
Cash flows from operating activities |
23,761 |
20,186 |
1,747 |
22,321 |
40,932 |
| Cash flows from investing activities |
△19,575 |
△1,648 |
△12,753 |
△15,495 |
△18,817 |
Per share data(Yen)
|
item |
2021/3 |
2022/3 |
2023/3 |
2024/3 |
2025/3 |
|---|---|---|---|---|---|
| Earnings per share(EPS) |
84.40 |
126.22 |
49.54 |
49.89 |
92.34 |
| Book value per share(BPS) |
1,159.49 |
1,286.82 |
1,339.89 |
1,496.93 |
1,575.90 |
| Dividends per share |
14.00 |
24.00 |
18.00 |
18.00 |
22.00 |
Key ratios
|
item |
2021/3 |
2022/3 |
2023/3 |
2024/3 |
2025/3 |
|---|---|---|---|---|---|
| EBITDA/Net sales(%) |
11.1 |
16.5 |
8.1 |
10.6 |
10.7 |
| Operating income ratio(%) |
0.8 |
7.8 |
5.7 |
5.1 |
6.5 |
| Net income ratio(%) |
6.4 |
8.1 |
2.8 |
2.8 |
5.1 |
|
Equity ratio(%) |
53.6 |
57.4 |
58.0 |
60.6 |
63.3 |
|
ROA (Note2)(%) |
2.8 |
8.0 |
3.0 |
4.4 |
4.5 |
|
ROE(%) |
7.6 |
10.3 |
3.8 |
3.5 |
6.0 |
|
Debt equity ratio(times) |
0.59 |
0.46 |
0.46 |
0.41 |
0.34 |
- EBITDA=Ordinary income+interest expenses+depreciation costs+depreciation of goodwill-depreciation of negative goodwill
- ROA=Ordinaly income ÷ average total assets at the beginning and end of the fiscal year × 100